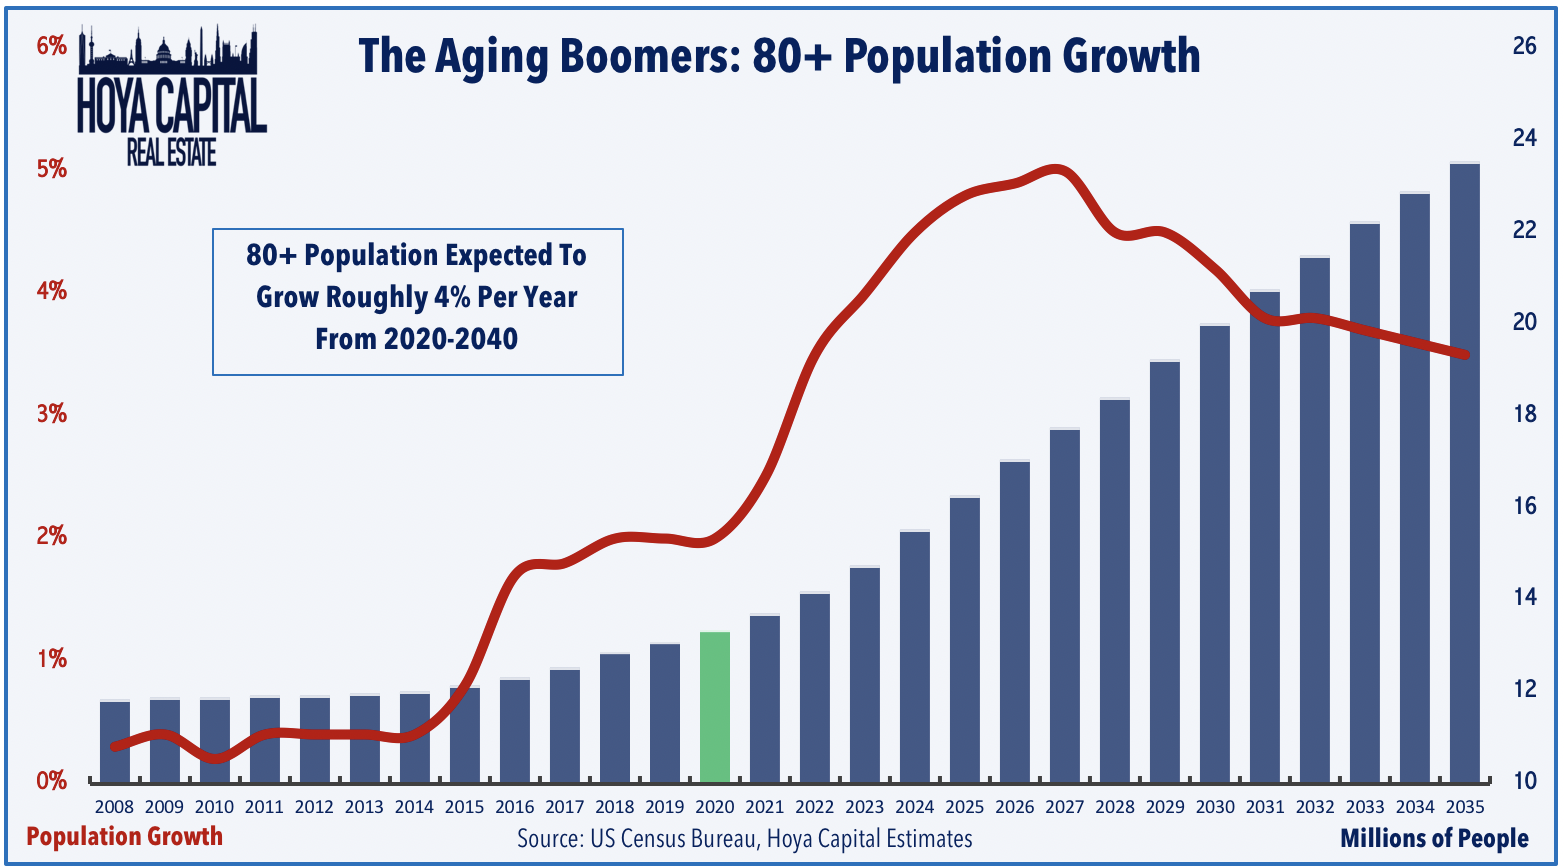
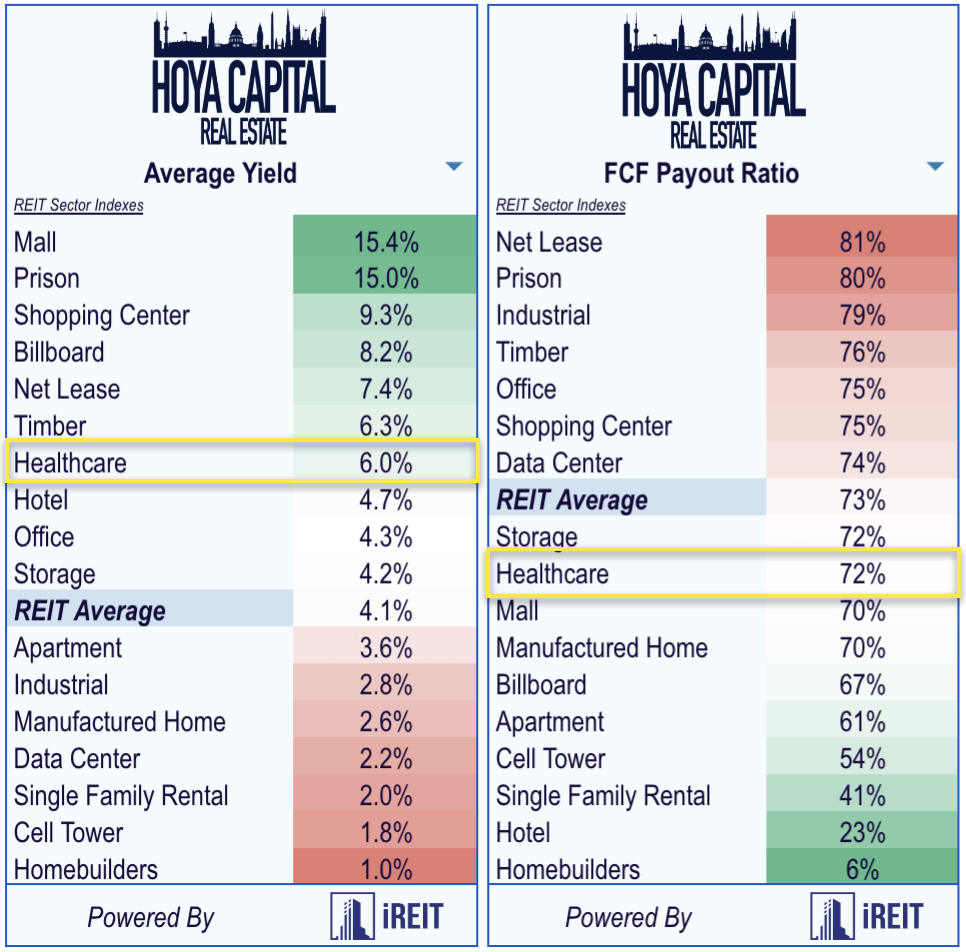
In a country where over 10,000 people turn 65 daily, it’s safe to say that an aging population will drive the demand for healthcare resources for years to come.
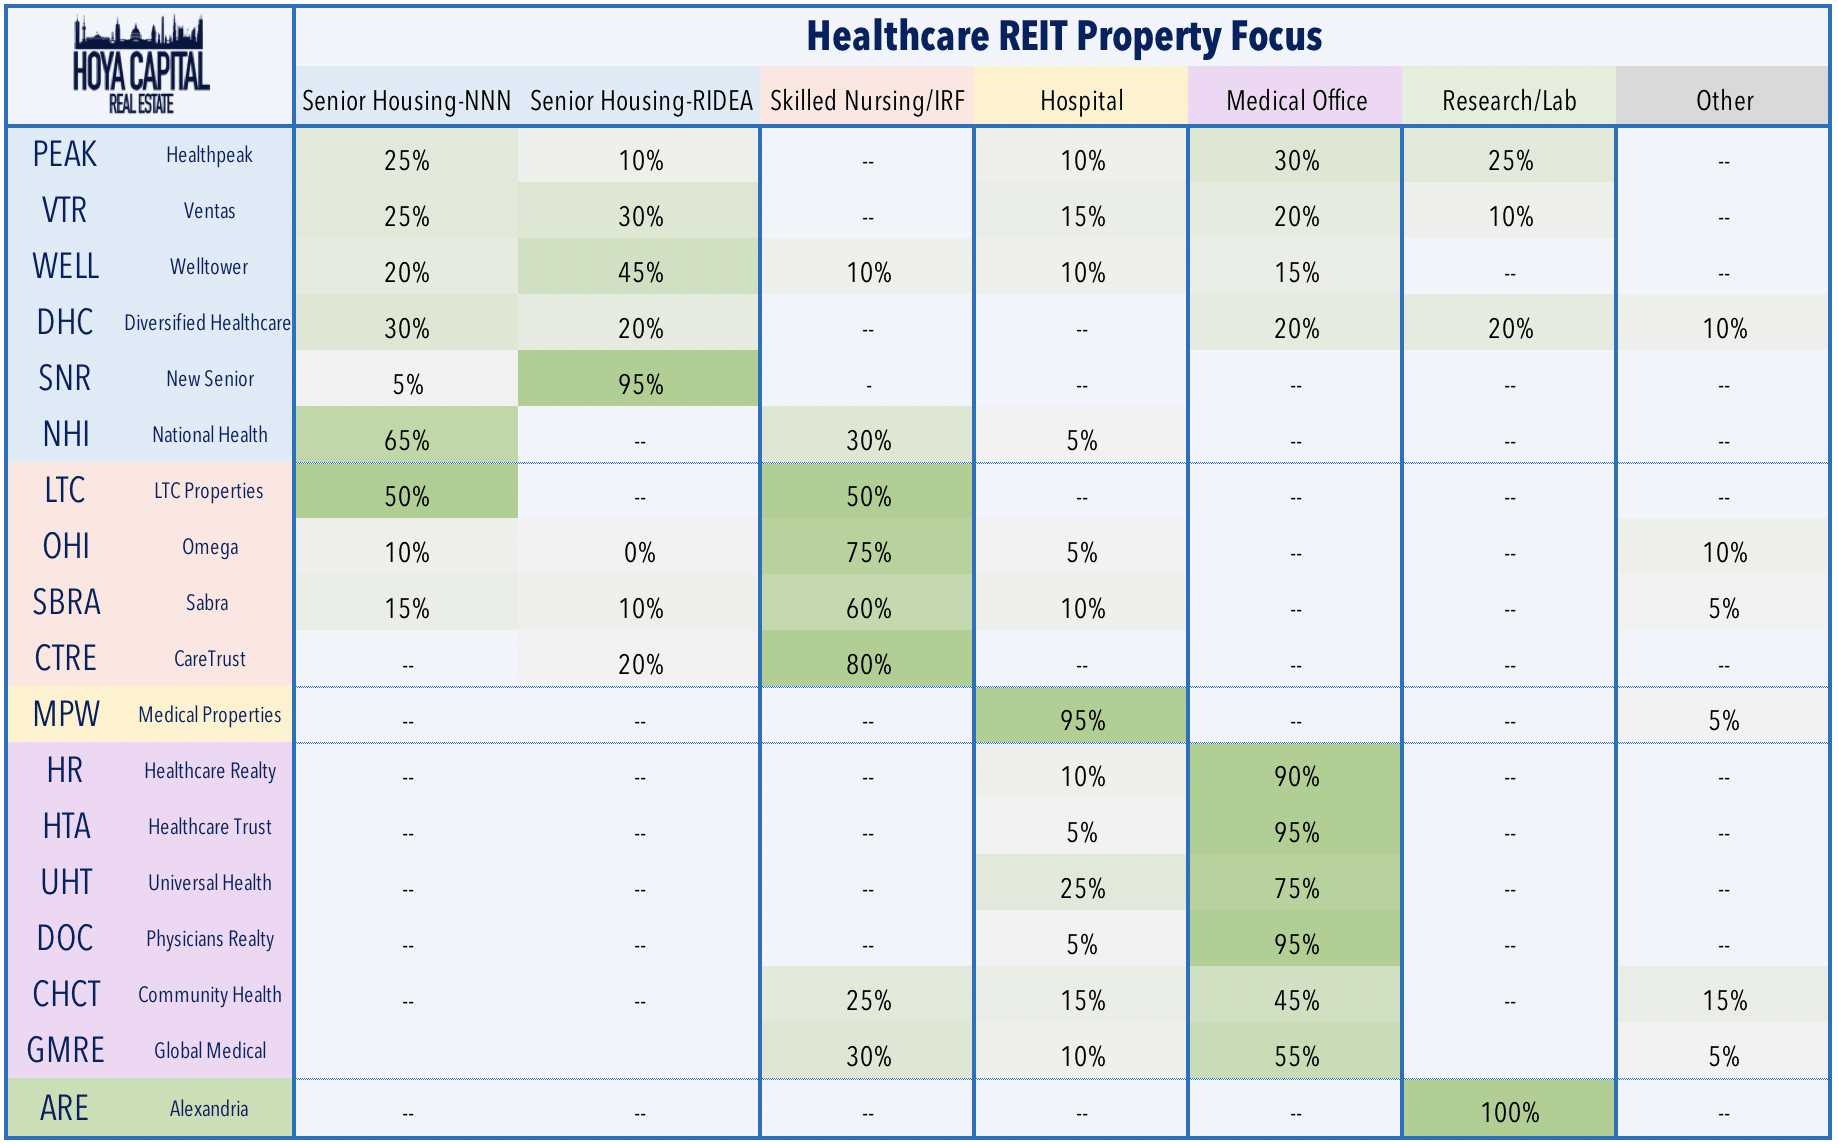
Healthcare Trust of America (NYSE:HTA) is a real estate investment trust that seeks to not only ride the irresistible wave of current demographic trends, but also aims to carve out strong footholds in markets where high tenant quality can be secured and leveraged to more profitable relationships. As the largest dedicated owner/operator of medical office buildings (MOB’s) in the U.S.,
HTA is also well-positioned to benefit from the broad shift away from expensive inpatient facilities, and instead toward more cost-effective outpatient resources, as healthcare spending already projects to account for fully 20% of GDP by 2026.
HTA currently has lots of competition in the medical property space (not just from other REIT’s either) as the sector is one of the few areas where growth is almost guaranteed to exceed nominal GDP growth for years to come. This has pushed the price of related real estate assets sky high, and has been something of a double-edged sword, because profitability on leases takes a bit of a hit as profit margins are eaten away by the rising cost of asset purchases. Fortunately, HTA‘s focus on specific markets with strong demographic dynamics, its fully-integrated property development capabilities, and prudent cost management have all combined to insulate profits somewhat more than peers. Past is not necessarily prologue, however, and challenges from interest rate volatility to changing investor sentiment and MOB demand can affect spreads, margins, and FFO numbers. With respect to HTA, I’ll look at the company’s structure, competitive position, real estate portfolio, financial strength, and underlying fundamentals of the stock to help current and prospective investors assess whether HTA is a buy at current prices, and what the long-term outlook is for the company and the stock.
 (Image source: HTA 2018 annual report)
Finding its Niche
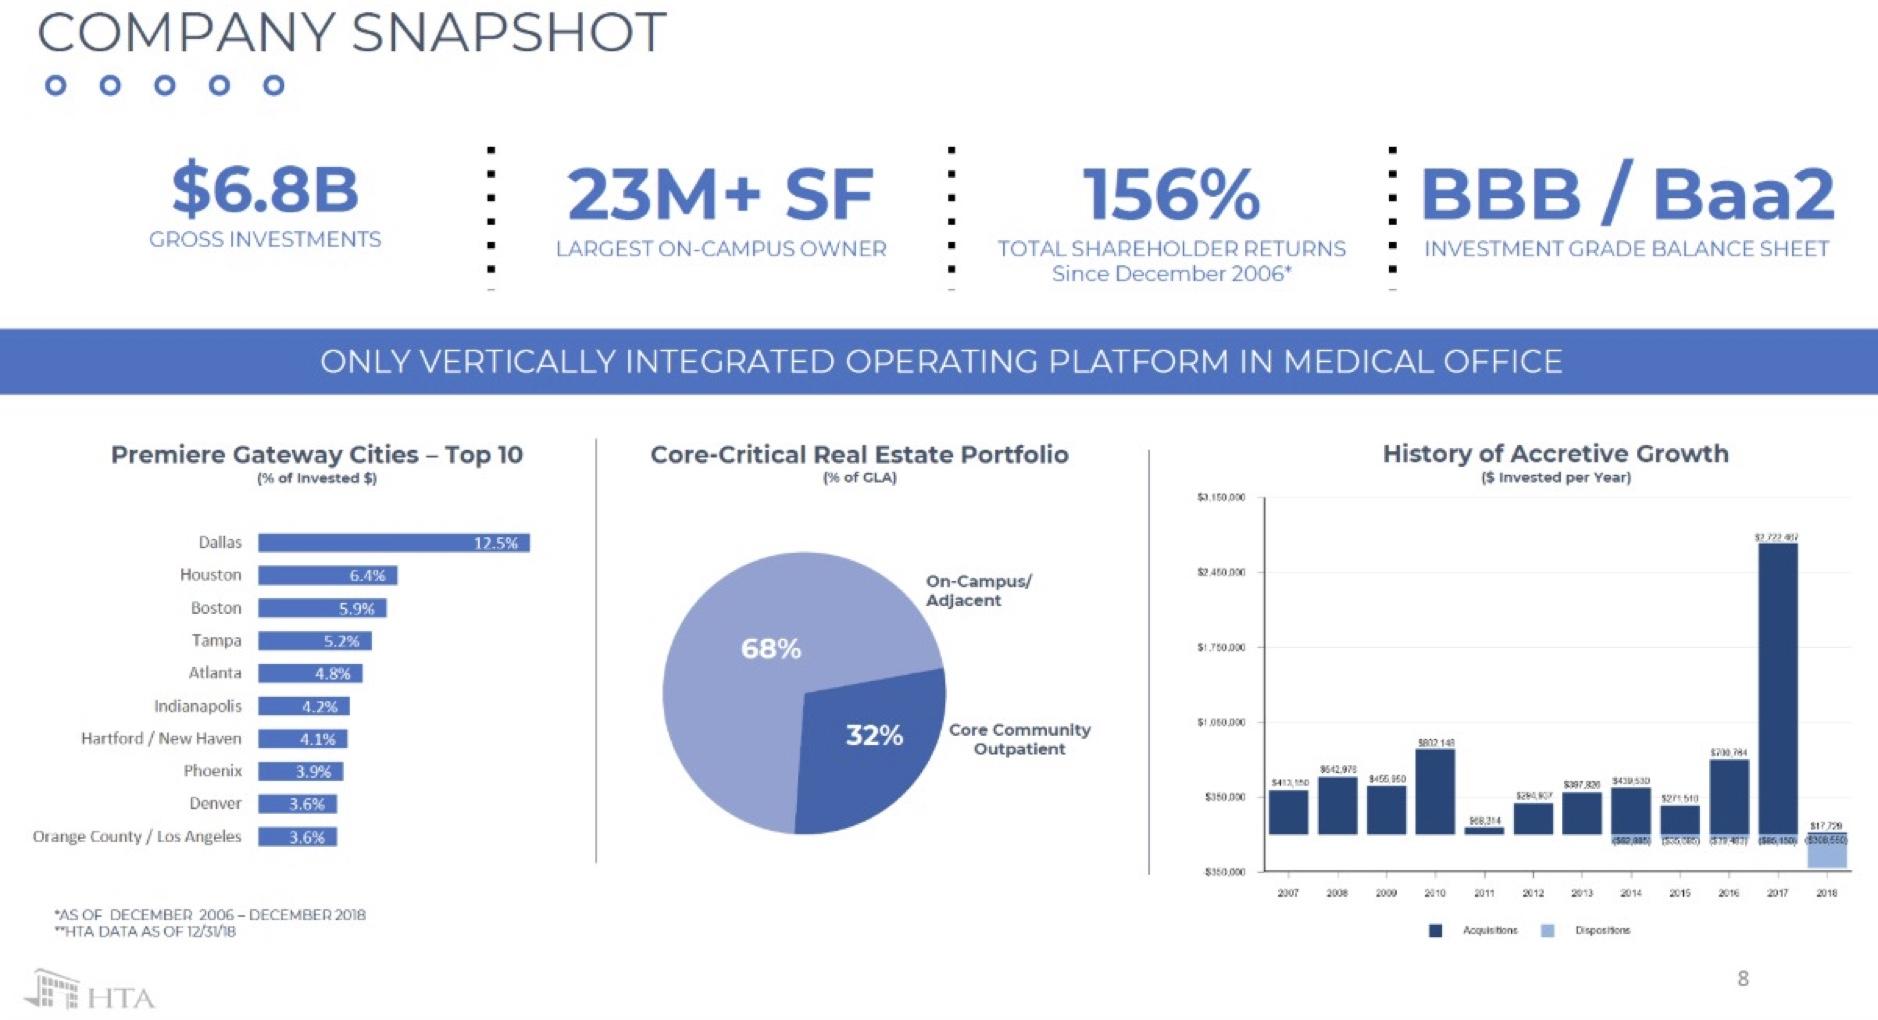
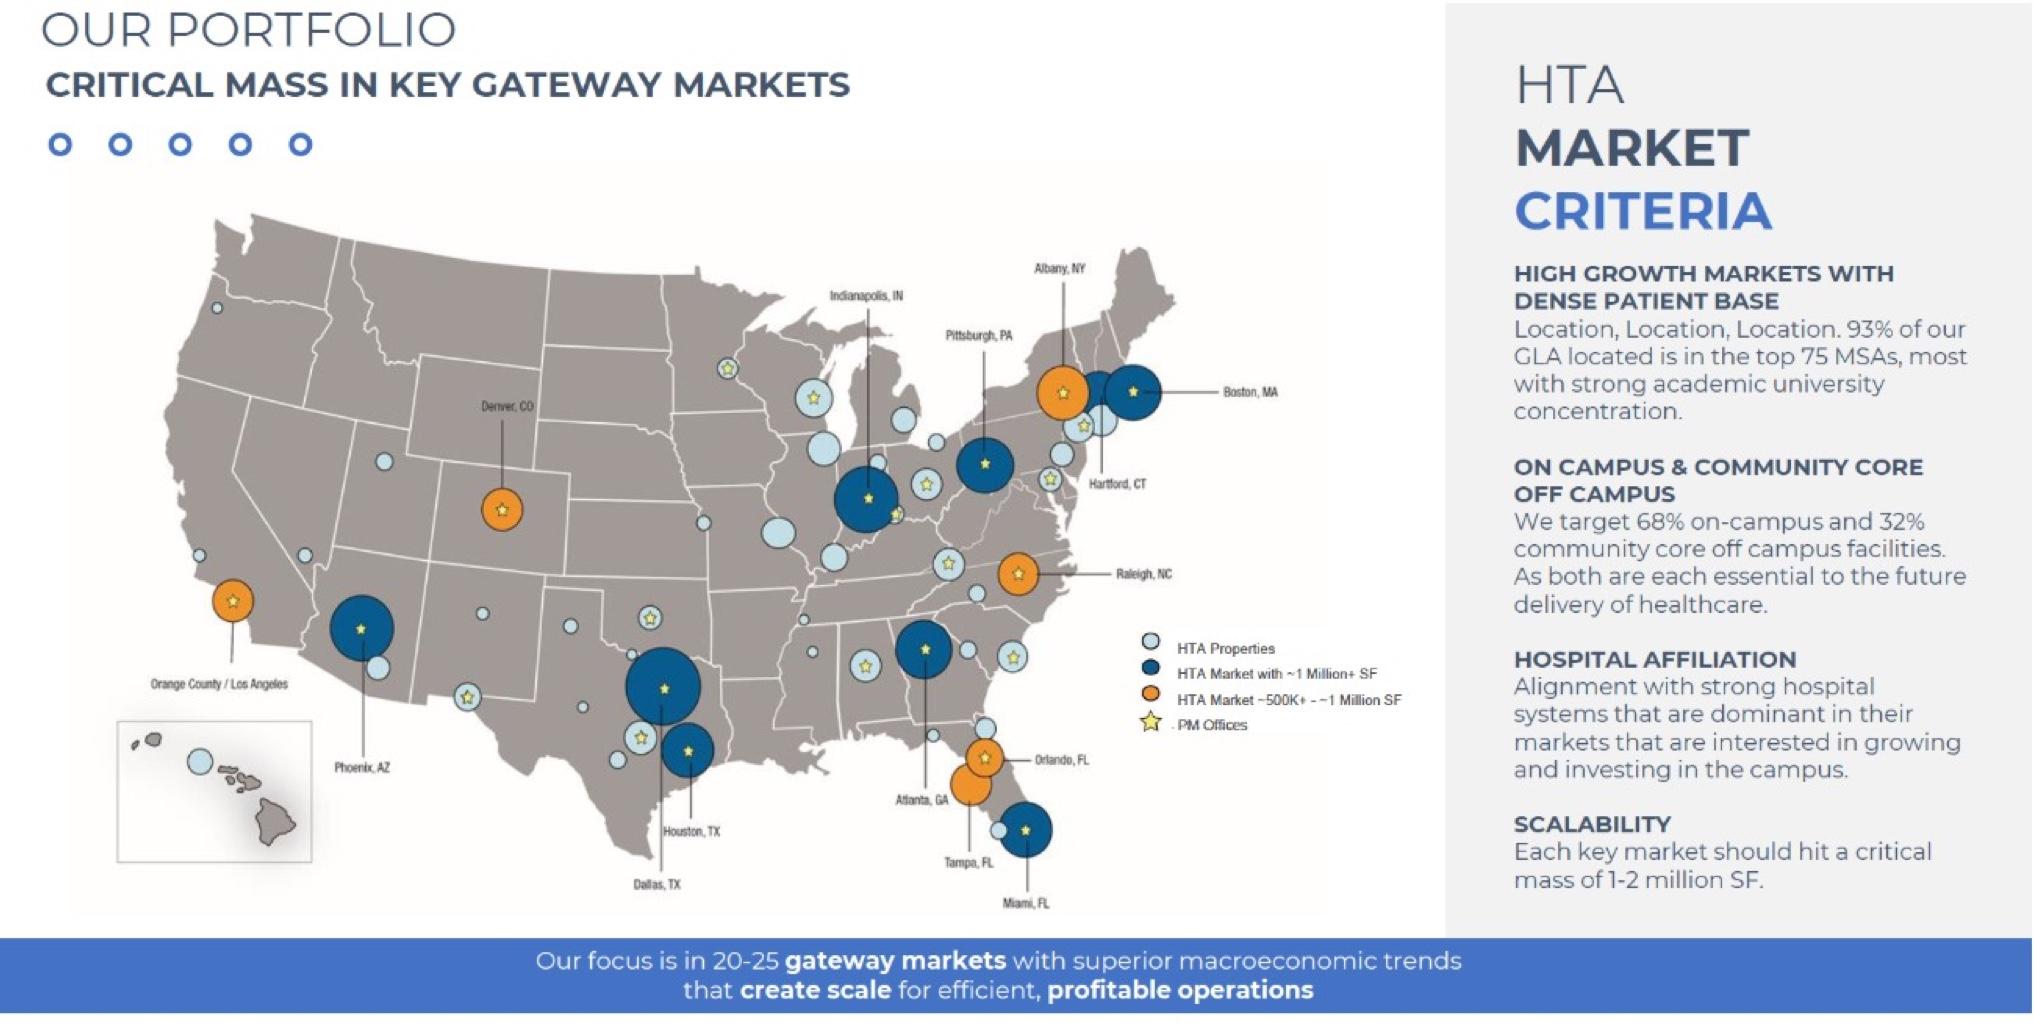
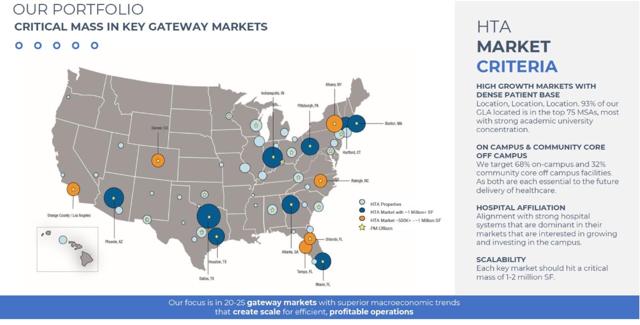
As the single largest owner of MOB’s in the U.S., HTA‘s real estate portfolio comprises 23 million sq. feet of GLA (gross leasable area), having invested roughly $6.8 billion in those properties over the last 10 years. While the firm has considerable market breadth across the country, it does try to focus on 20-25 “gateway markets” where it seeks to “build critical mass,” especially in communities with universities and large extant medical institutions. The thinking is that this strategy presents not only favorable demographic trends for local demand, but also supply in the form of skilled-labor and job growth. Consequently, the company has already started to see some of the benefits via robust long-term demand for medical office management and leasing services. Overall, the firm has an integrated asset management model consisting of on-site leasing, property management, engineering and building services, and targeted real estate development. With a focus on operational efficiency and tenant quality, HTA has sought to build lasting relationships with dependable clients, and achieve real rental growth. Management hopes this combination will lead to peer-beating value-creation in the long-run.
 (Image source: HTA investor presentation)
Founded in 2006 as a private REIT, HTA went public on the NYSE in 2012. Headquartered in Scottsdale, AZ, the firm has quickly expanded as it has not only emerged from the depths of the real estate and financial crash of 2007-8, but benefited from the growth of healthcare in general, and its own target markets in particular. This concentration in a few key markets has allowed the company to build strong competitive positions within those communities, and has actually led to relatively strong operating margins. Further, management’s focus on the firm’s financial strength and liquidity has allowed for continued investment and development, leading to accretive acquisitions and leasing relationships. Those strong tenant relationships foster increased margins, higher tenant retention, better leasing spreads, and more and better growth opportunities.
 (Source: Author, Benjamin Black)
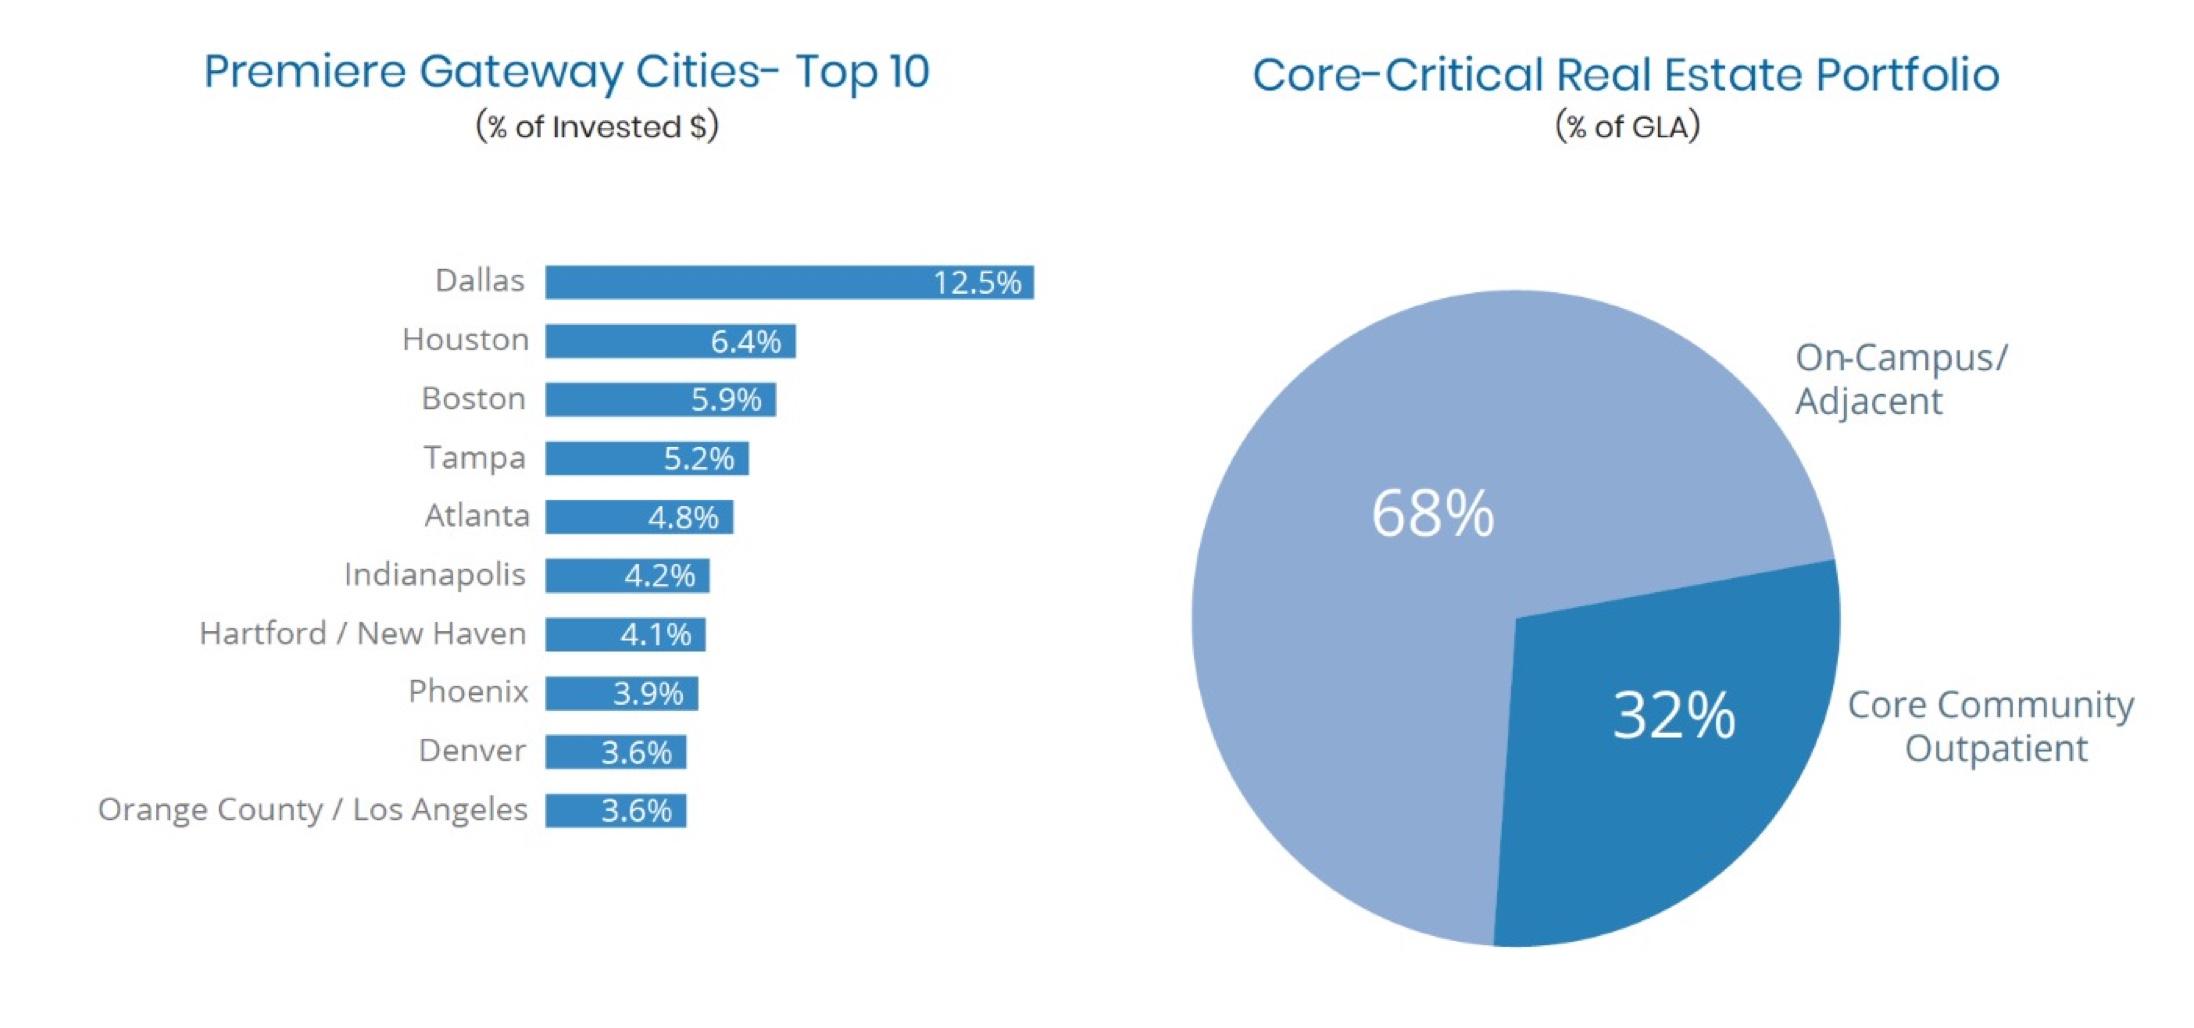
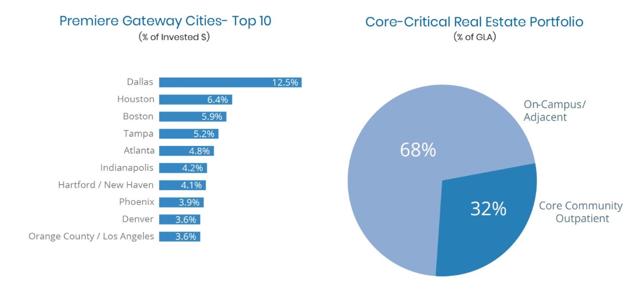
The operating platform consists of four main segments, including property management, maintenance services, leasing services, and construction & development. This multifaceted approach has allowed HTA to not only capitalize on leasing and property management fees, but also build its footprint through development and property investment. While 93% of the company’s overall GLA consists of in-house property, the top 20 markets comprise 75% of GLA as well, which is actually a 12% increase since 2013 (when it was 63%). What this shows, given HTA‘s ballooning real estate portfolio during this time period, is a strengthening position in the markets it chooses to focus on. The portfolio is increasingly concentrated in large and growing markets with high MOB demand, and top markets now include Dallas, Houston, and Boston, among other expanding metro areas with favorable demographics. Specifically, HTA targets strong same property cash NOI growth.
 (Image source: HTA investor presentation)
Growing the Portfolio
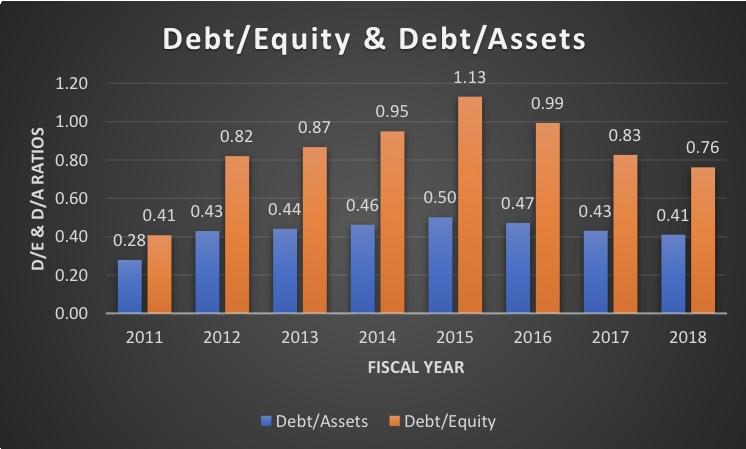
Since the end of 2013, HTA has doubled its portfolio in terms of GLA and property value (from $2.6 billion to $5.4 billion). Over this same period, leverage (net debt/EBITDAre) has remained fairly steady at a rate between 5 and 6X, falling at a respectable 5.8X in 2018. Cash from operations and use of the firm’s ATM equity program have largely financed the acquisitions. Solid enterprise value growth and normalized FFO growth of 27% (through 2018) help underscore the merits of a strategic focus on core-community, on-campus, and academic medical center locations. The economics and demographics of university-heavy cities favors MOB demand and related pricing. What sets HTA apart from peers is its vertically-integrated operating platform allowing it somewhat of a unique offering to customers. This has translated to success for investors in the underlying stock, as the REIT has outperformed not only broader REIT indices, but also the healthcare REIT index as well. Of course, this underlying performance does include some years as a private REIT, where returns are calculated mainly by factoring in total distributions over the period, but regardless, the 156% total return since ’06 compares favorably (bear in mind the period begins right around the height of the real estate bubble).
 (Source: Author, Benjamin Black)
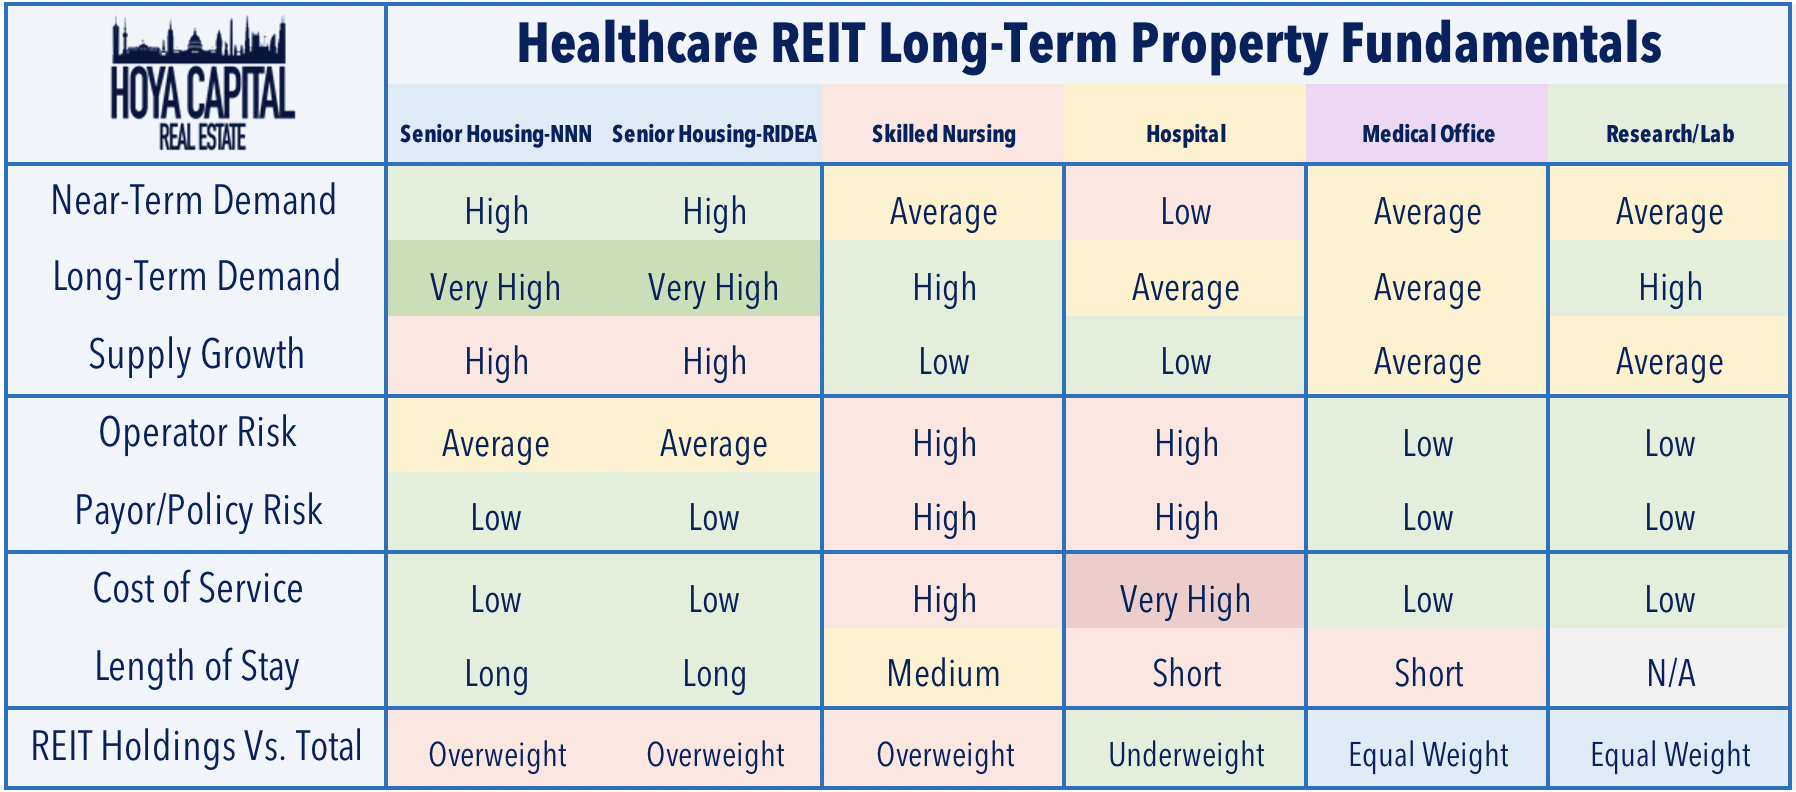
Healthcare delivery is expected to shift to more outpatient facilities over time due to it being more cost-effective than inpatient care. Additionally, limitations to existing hospital resources have further enhanced outpatient visit growth. In fact, inpatient visits have begun to decline in recent years, despite the growing demand for healthcare overall, which is especially beneficial to MOB operators. While demographic and industry dynamics favor the MOB REIT sector generally, HTA‘s laser-like focus on key “gateway” markets further drives growth and profitability. In addition to this, the consolidation of healthcare providers will likely lead to increased opportunities for MOB operators with scale (such as HTA).
 (Source: Author, Benjamin Black)
MOB’s are desirable to providers because they help augment provider growth by helping to limit capital outlay/commitments by providing leasable properties, and also limit the volatility of cash-flows. The ability to develop synergistic and profitable relationships with strong providers depends greatly on location, barriers to entry, and operational efficiency of both the leaseholder and the property manager. That said, the MOB sector is especially fragmented, as less than 20% of the market is institutionally owned. Further, REIT’s only have an 11% share of the MOB market, which is less than private equity, developers, and providers themselves. Of that relatively small slice of the pie, however, HTA is fast becoming a dominant player.
Competitive Position
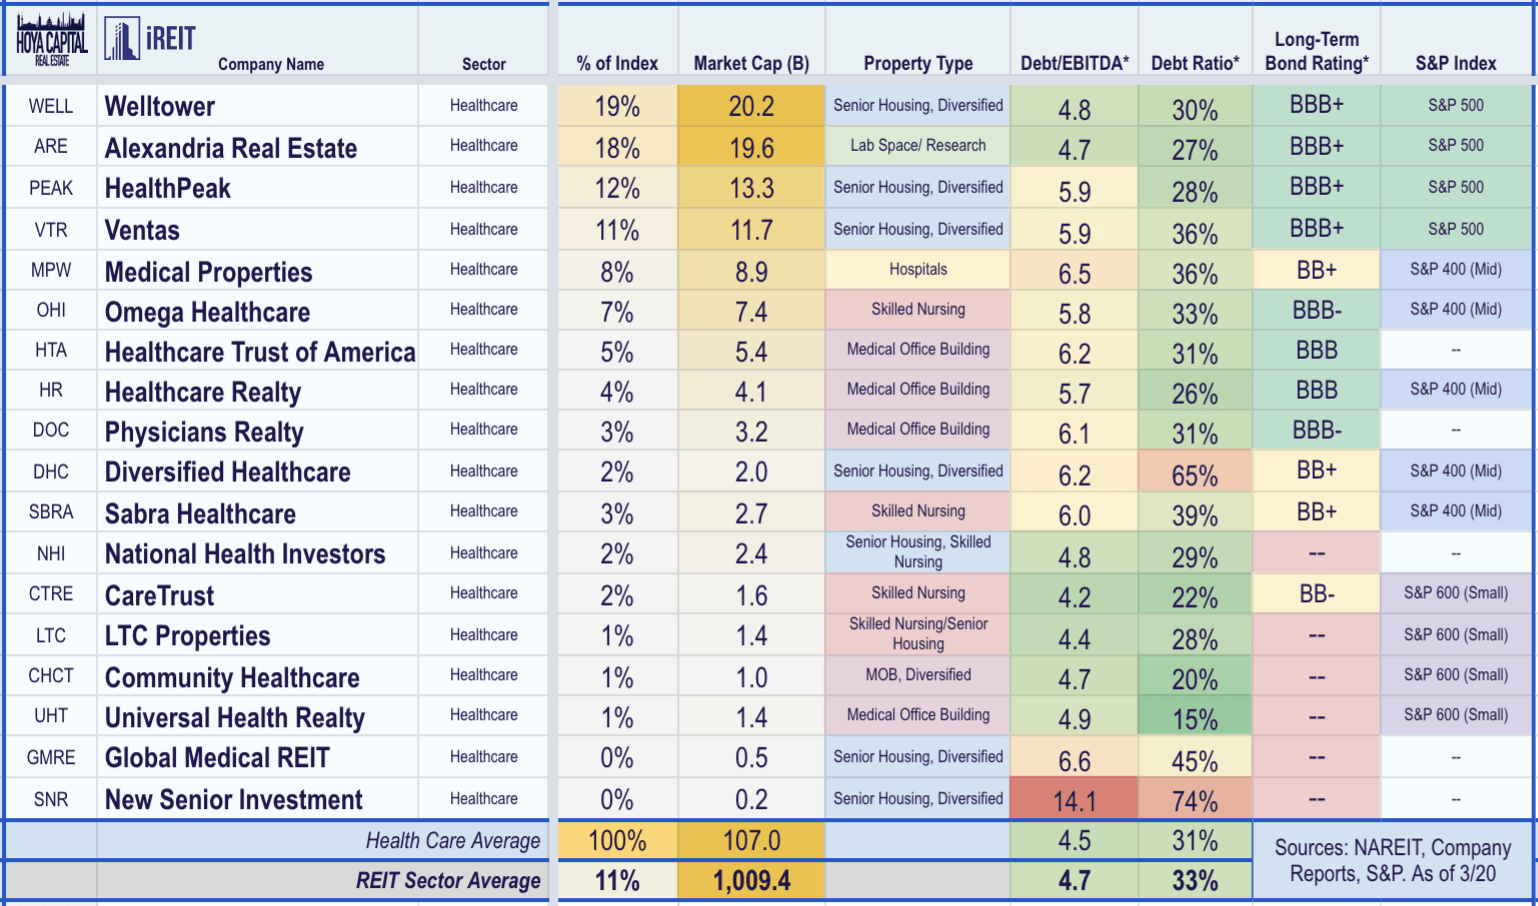
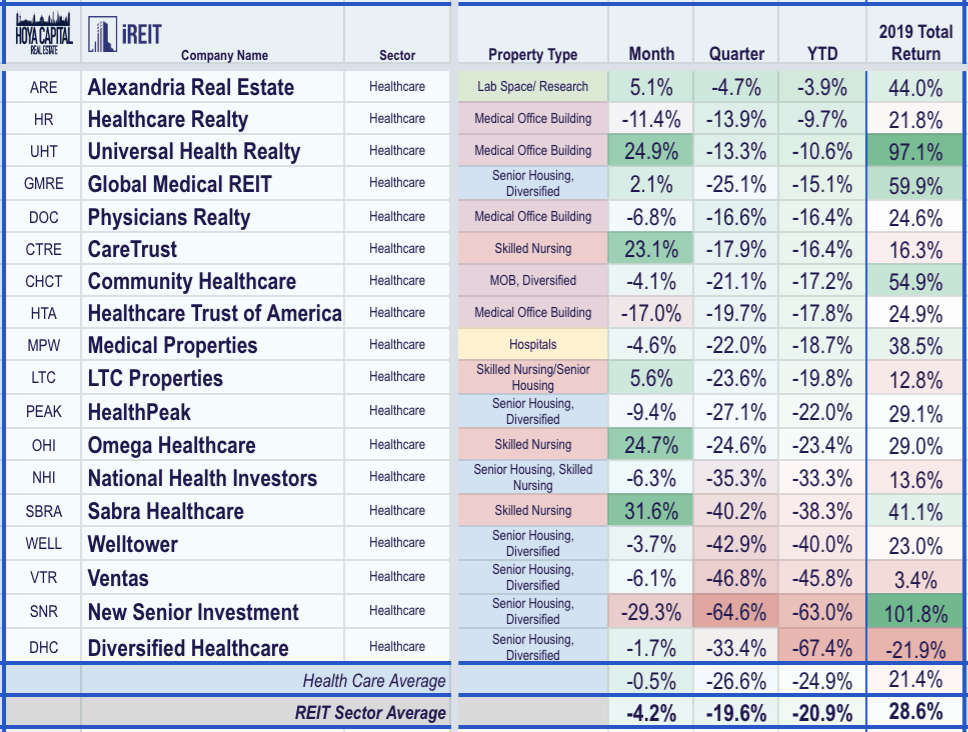
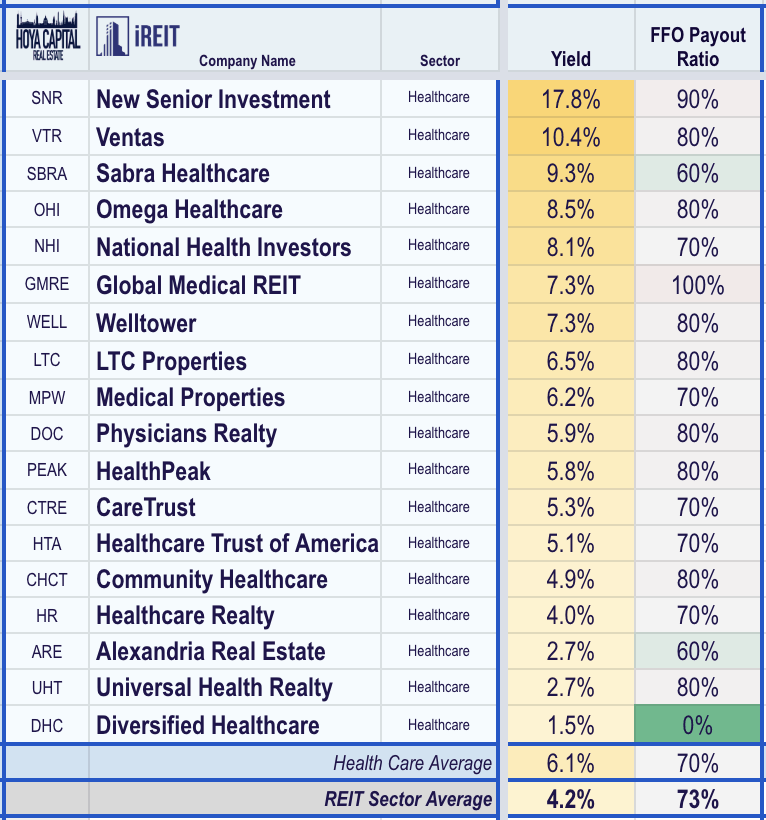
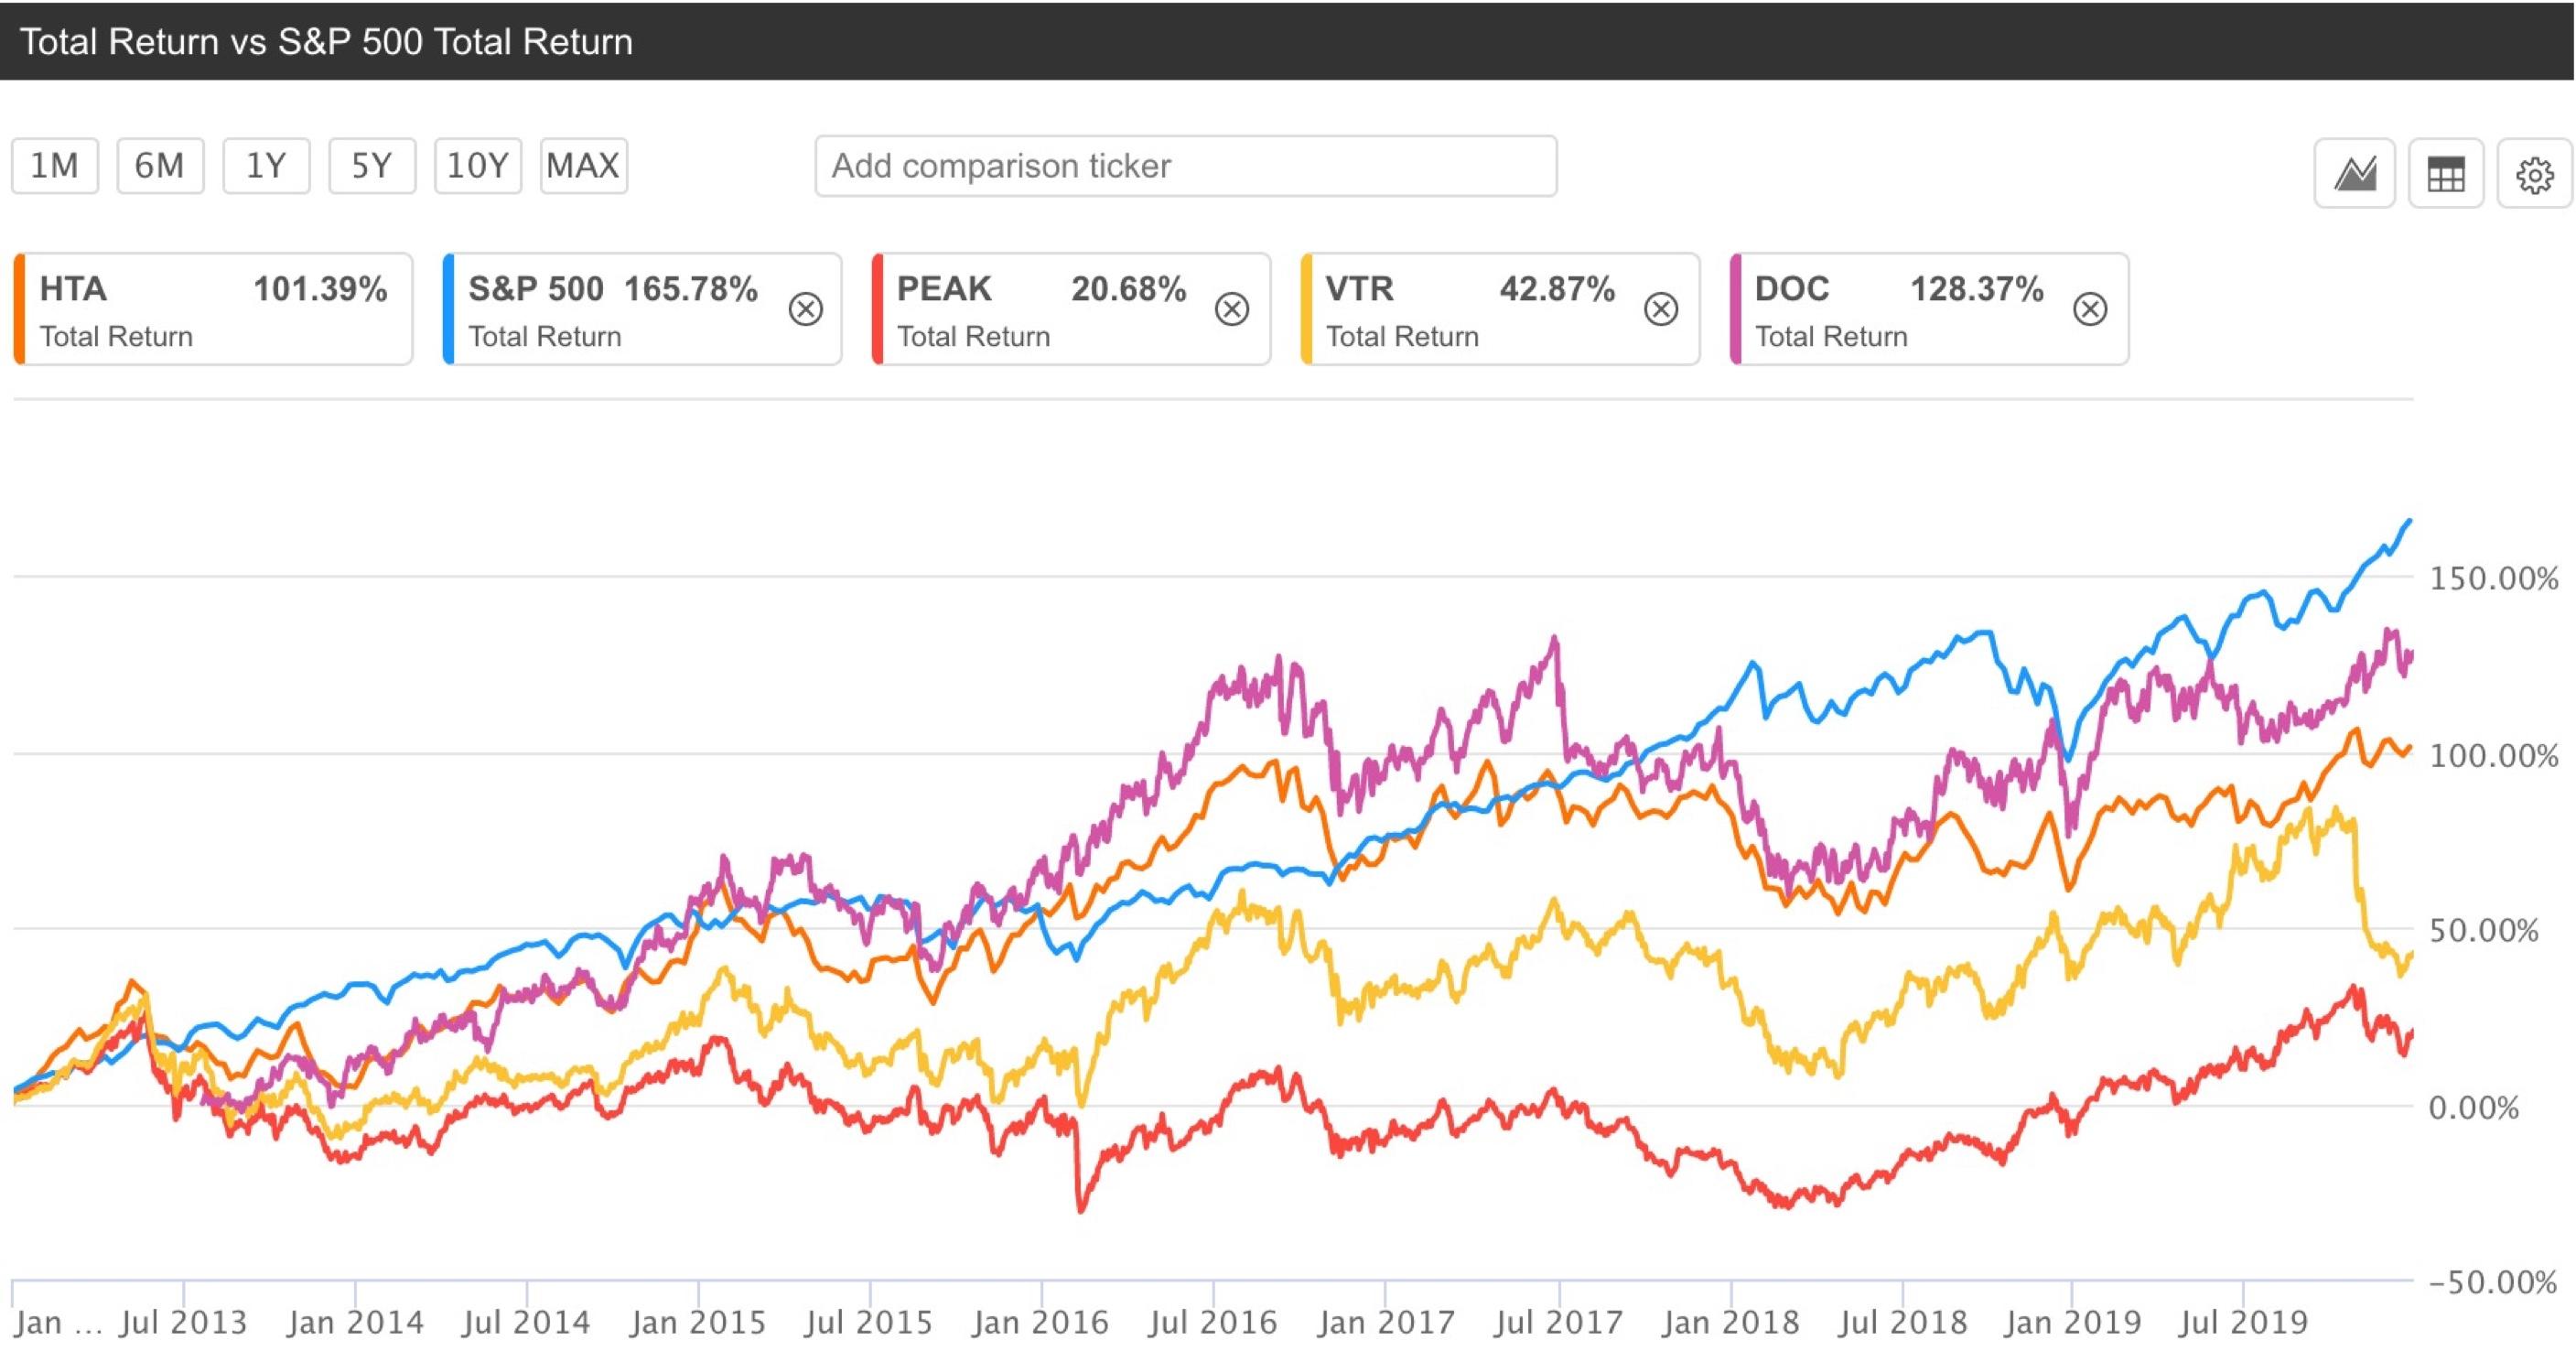
From 2012-2018, annualized FFO growth of 4.6% matches that of Welltower (NYSE:WELL), and is above peers H&R REIT (OTCPK:HRUFF) (3.3%), Ventas Inc., (NYSE:VTR) (1.2%), and Healthpeak Properties (NYSE:PEAK) (-1.7%). Same-property cash NOI growth, which I’ll refer to as SS (similar to same-store growth in retail), averaged 3% from 2013-2018, bested only by HRUFF (3.2%), and ahead of Physicians Realty Trust (NYSE:DOC) (2.6%), WELL (2.3%), VTR (1.4%), and PEAK (1.3%). Total shareholder returns meanwhile, have outpaced them all, coming in at 68% over the period (vs. a range of -6% to 54% for the previously mentioned companies).
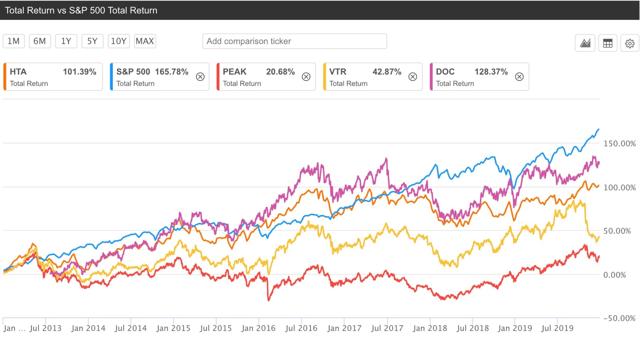 (Image source: SEEKING ALPHA HTA STOCK PAGE)
PEAK (formerly HCP) in particular, has struggled over the last 5-6 years, and HTA may stand to benefit as a result. Note that in 2 of the last 4 quarters, SS growth fell below the REIT MOB average of 2.6%. Prior to that, from 2014-17, HTA grew cash NOI at a range between 2.8-3.3%. It has hit a low of 2.3% in 1Q18, but has since recovered to 2.7% as of 4Q18. The good news, however, is that since 2014, SS expenses for the company have actually declined, averaging -0.8% vs. an average of +0.9 to 3.4% for peers (including WELL, VTR, HCP, DOC, and HRUFF), which collectively averaged 1.75%. This disparity shows HTA‘s greater efficiency and cost management than peers. So, over the last 5-6 years overall, same-property figures look healthy, but keep an eye on the trend, and take special note of any further deterioration in NOI growth rates, or rising same-property expenses.
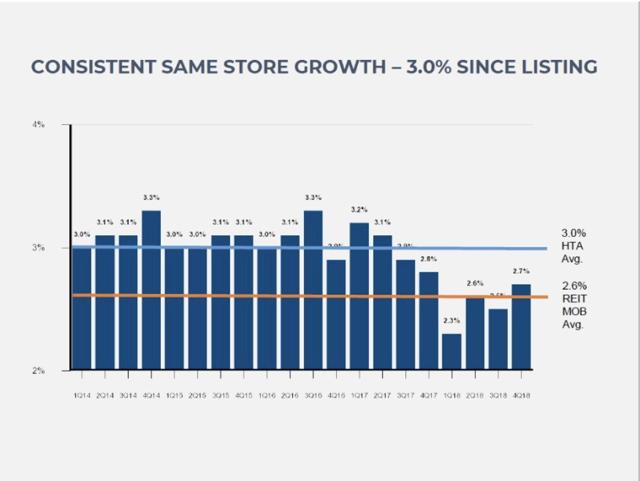 (Image source: HTA investor presentation)
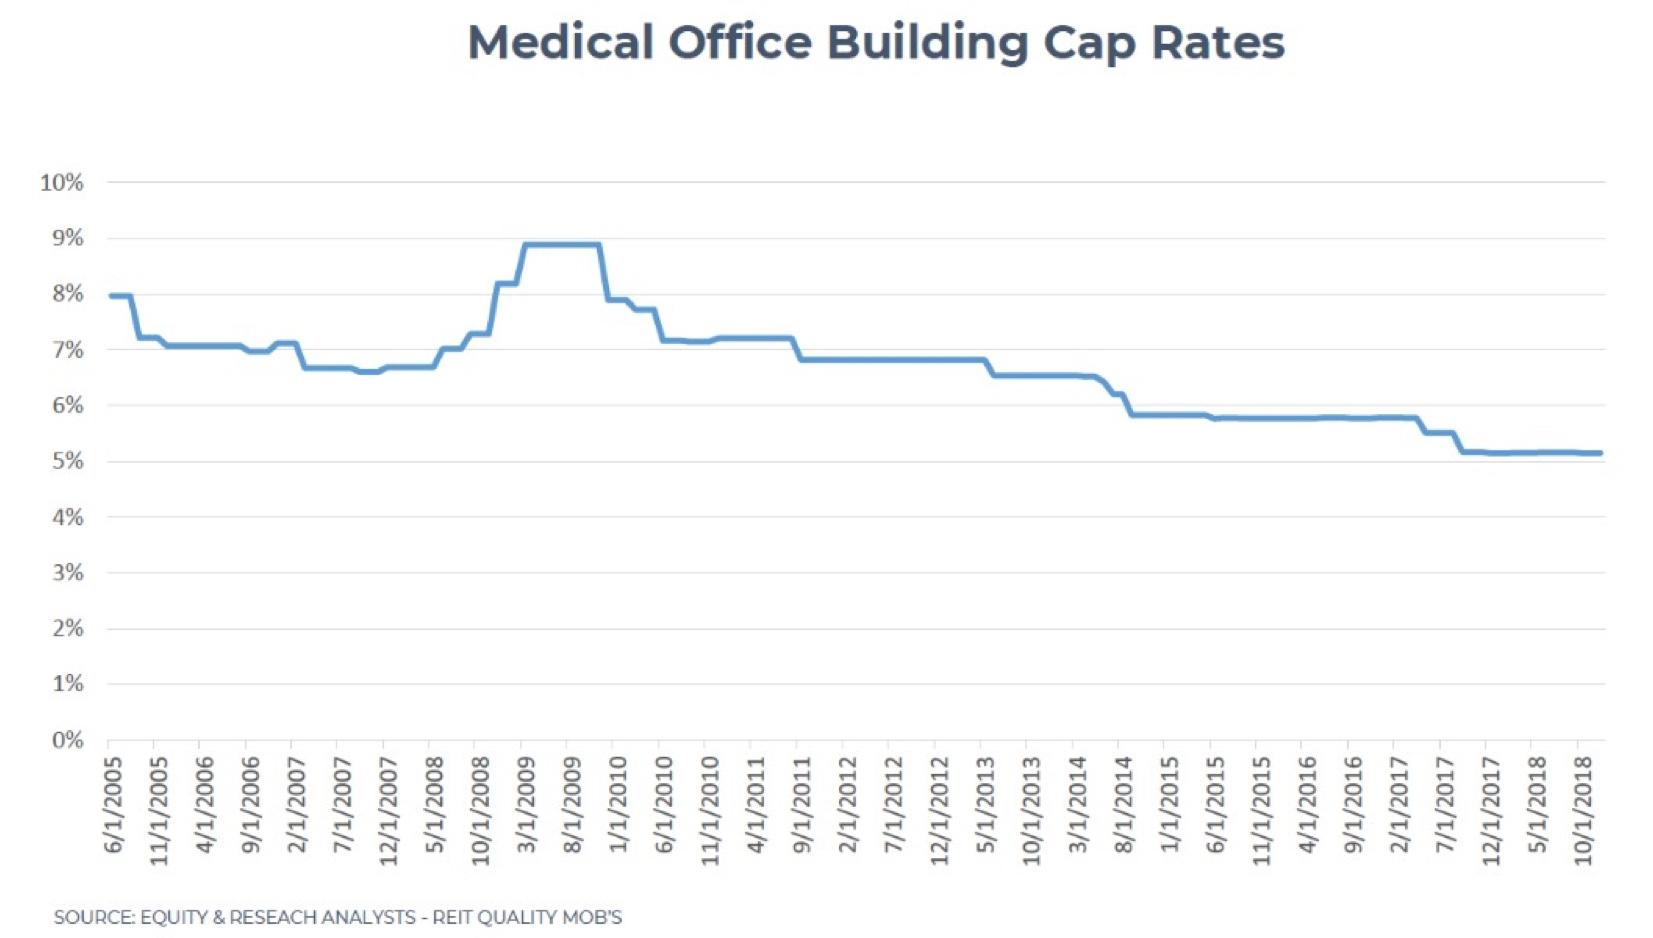
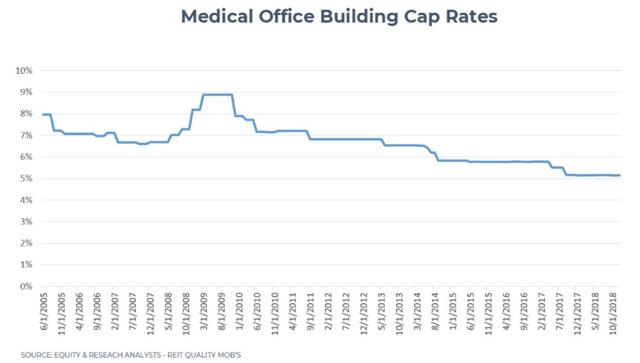
It’s important to note that the MOB sector (and healthcare real estate investment generally), is currently experiencing a period of record low cap rates. Cap (capitalization) rates are the ratio of net operating income (NOI) to property asset value, and such rates have fallen in recent years due to high investor demand and fast-rising property values. One major reason for this trend is that health-related real estate is seen as a sector of fairly reliable growth; in fact, total number of outpatient visits has grown by almost 2% annually between 1994-2014. By comparison, over the same period, inpatient admissions actually declined by 0.67% annually.
 (Source: Author, Benjamin Black)
Investor demand remains at an all-time high for healthcare real estate assets, and especially MOB’s, consequently pushing down cap rates and therefore profit margins and ROI expectations. Because healthcare is seen as one of the strongest drivers of economic growth in the U.S. going forward, investors continue to position their portfolios to reflect that trend. Total healthcare real estate volumes, though, stayed roughly the same for 2019 as 2018, mostly due to the lack of available properties, presenting an opportunity for profitable MOB development in key markets where demand is particularly robust.
And the Survey Says…
In a survey of medical real estate investors, CBRE showed that 94% of respondents favored MOB’s for acquisition, by far the highest of any building type (ambulatory surgery centers (ASC’s) were 2nd at 69%, for some perspective). These results further underscore the high continued demand for MOB’s, and the resultant tight supply-demand and pricing environment. Expected cap rates for MOB’s in 2019 are between 5-6%, which represents the lowest cap rates for all medical building/real estate investment categories, including ASC’s, wellness centers, LTC hospitals, rehab hospitals, etc. Only 2% of survey respondents felt that 2019 would see lower investor demand for MOB’s than 2018, and only 1% of respondents said that occupancy rates of their MOB portfolio had fallen from the prior year (99% said it was the same or higher). Generally, survey results show that the bulk of those asked see annual growth for medical office lease rents falling between 2-3%, largely reflective of inflation expectations and GDP growth.
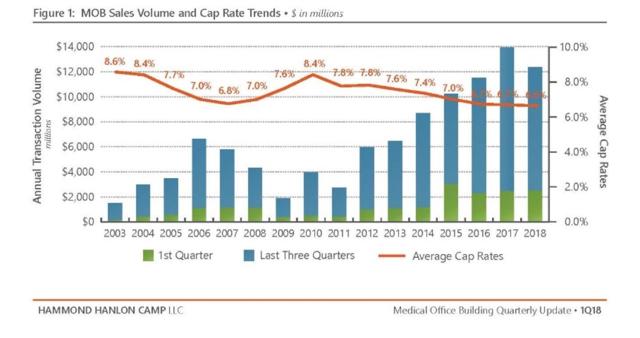 (Source for the above two images: HTA investor presentation and Hammond Hanlon Camp LLC 2018 MOB report, attached at the end of the article)
In 2018, the “tightening of the spread between sales and development capitalization rates (had) many developers on edge given the rising interest rate environment.” Fortunately, interest rates have actually fallen over the last year, as the Fed has lowered the Fed Funds Rate by 0.25% on three separate occasions in the TTM period. In the 24 months between the beginning of 2017 and the end of 2018, construction costs generally increased between 15-30% (depending on the market). Despite this surge, rental increases generally kept pace with rising construction costs, as the growing economy allowed developers to pass on rising costs. Additionally, cheap credit continues to augment market growth as loan-to-value ratios remain elevated at between 65-90%, and are increasingly occurring at the higher end of that range.
The Fundamental Picture
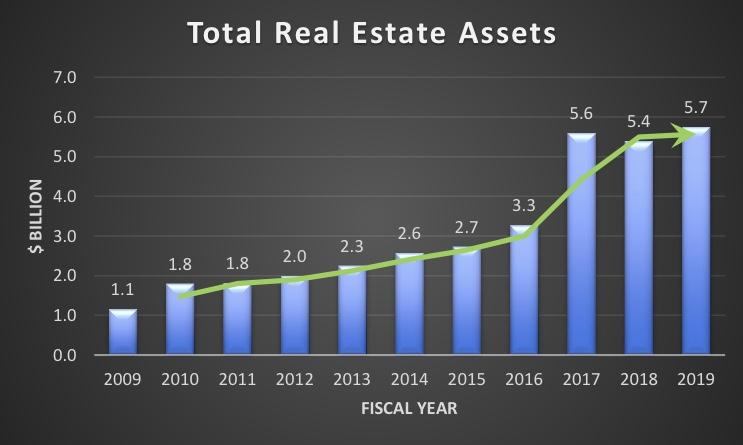
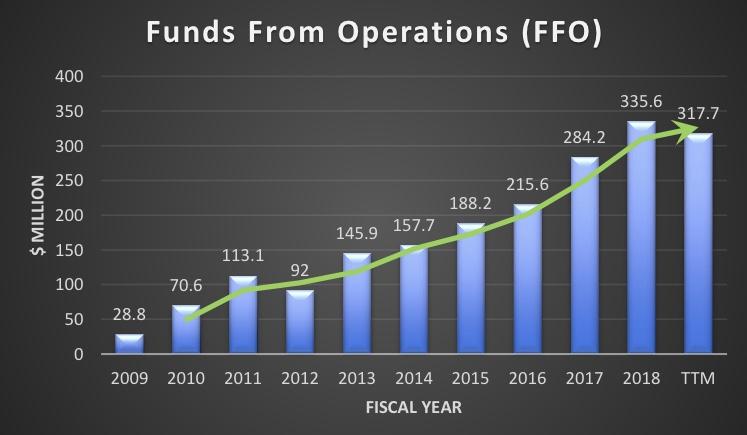
While the healthcare industry is clearly growing (average healthcare spending per person rose 11% in 2017 alone, for example), not all MOB operators are created equal, and not all markets are especially geared towards that sector’s growth. HTA with its university-centric market approach (it targets a portfolio composition of 68% of GLA from on-campus properties, and 32% off-campus), seems to have found a profitable niche. Growing its real estate assets from $1.7 billion to $5.7 billion from 2009-2019 (12.86% CAGR), HTA has greatly expanded its portfolio and simultaneously managed to grow its FFO from $28.8 million to $317.7 million, producing a CAGR of roughly 27%. Meanwhile, management has grown overall EBITDA from $61.3 million to $416.2 million (21.1% CAGR) over the same period.
 (Source: Author, Benjamin Black)
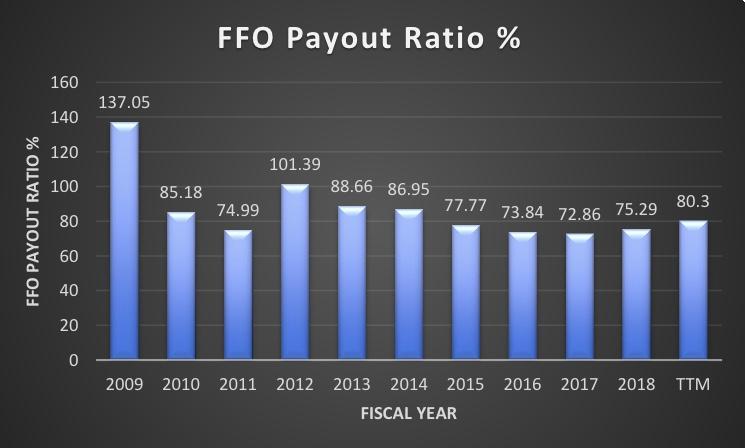
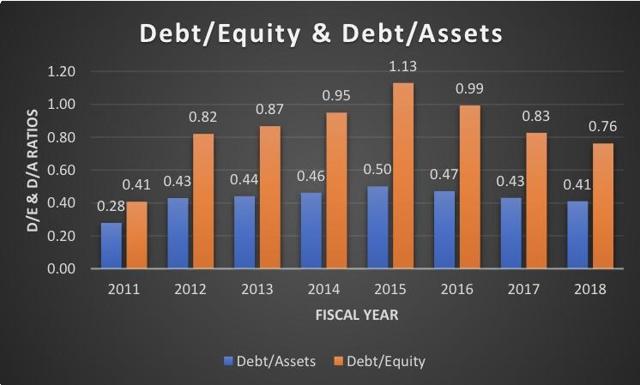
While the annual dividend was higher in 2010 at $1.46 per share (vs. $1.24 in the TTM period), the FFO payout % was also much higher, at over 85% (vs. roughly 80% today). Dividends have increased annually since 2013, but at a compound annual growth rate of only 1.26%. The P/FFO ratio is just under 20 (at 19.8), and is reasonable, if not a screaming bargain. Reflecting on these numbers, HTA‘s focus is expanding its competitive position, showing very impressive top-line growth, but due to historically low cap rates and exploding real estate costs, that is not necessarily translating to stellar profit and dividend growth.
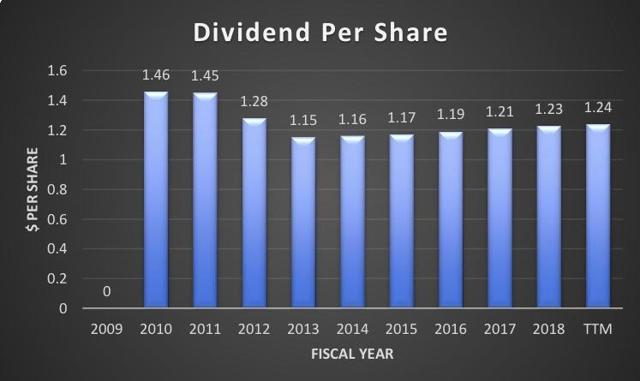
 (Source for the above two graphs: author)
The Bottom Line
While HTA is well-positioned as a leader in the healthcare REIT sector, shareholder returns will likely remain muted while asset prices and earnings multiples remain high (relative to historic norms). That said, this is a company to consider adding to your watchlist, as it is a best-of-breed operator in a growing sector of the economy in the long run. It’s a great company, but a so-so stock at the moment. If HTA were to fall 20-30% over the next few months, however, (or basically flat-line over the next 2-3 years), a reasonable and profitable entry-point would present itself, but wait for the underlying fundamentals to catch up to the price first.
*Most market and company-specific data drawn from HTA’s 2018 annual report or most recent investor presentation, found on the company’s investor website. Data used to construct graphs drawn from Seeking Alpha’s HTA stock page.
Source: Seeking Alpha